Tilt UI
Tilt Tutorial
Launching the Web UI
In your terminal window running tilt demo, press (Spacebar).
Tilt will open your default browser to the Tilt UI.
(Or navigate there directly in your preferred browser using the URL from the terminal.)
Resource Overview
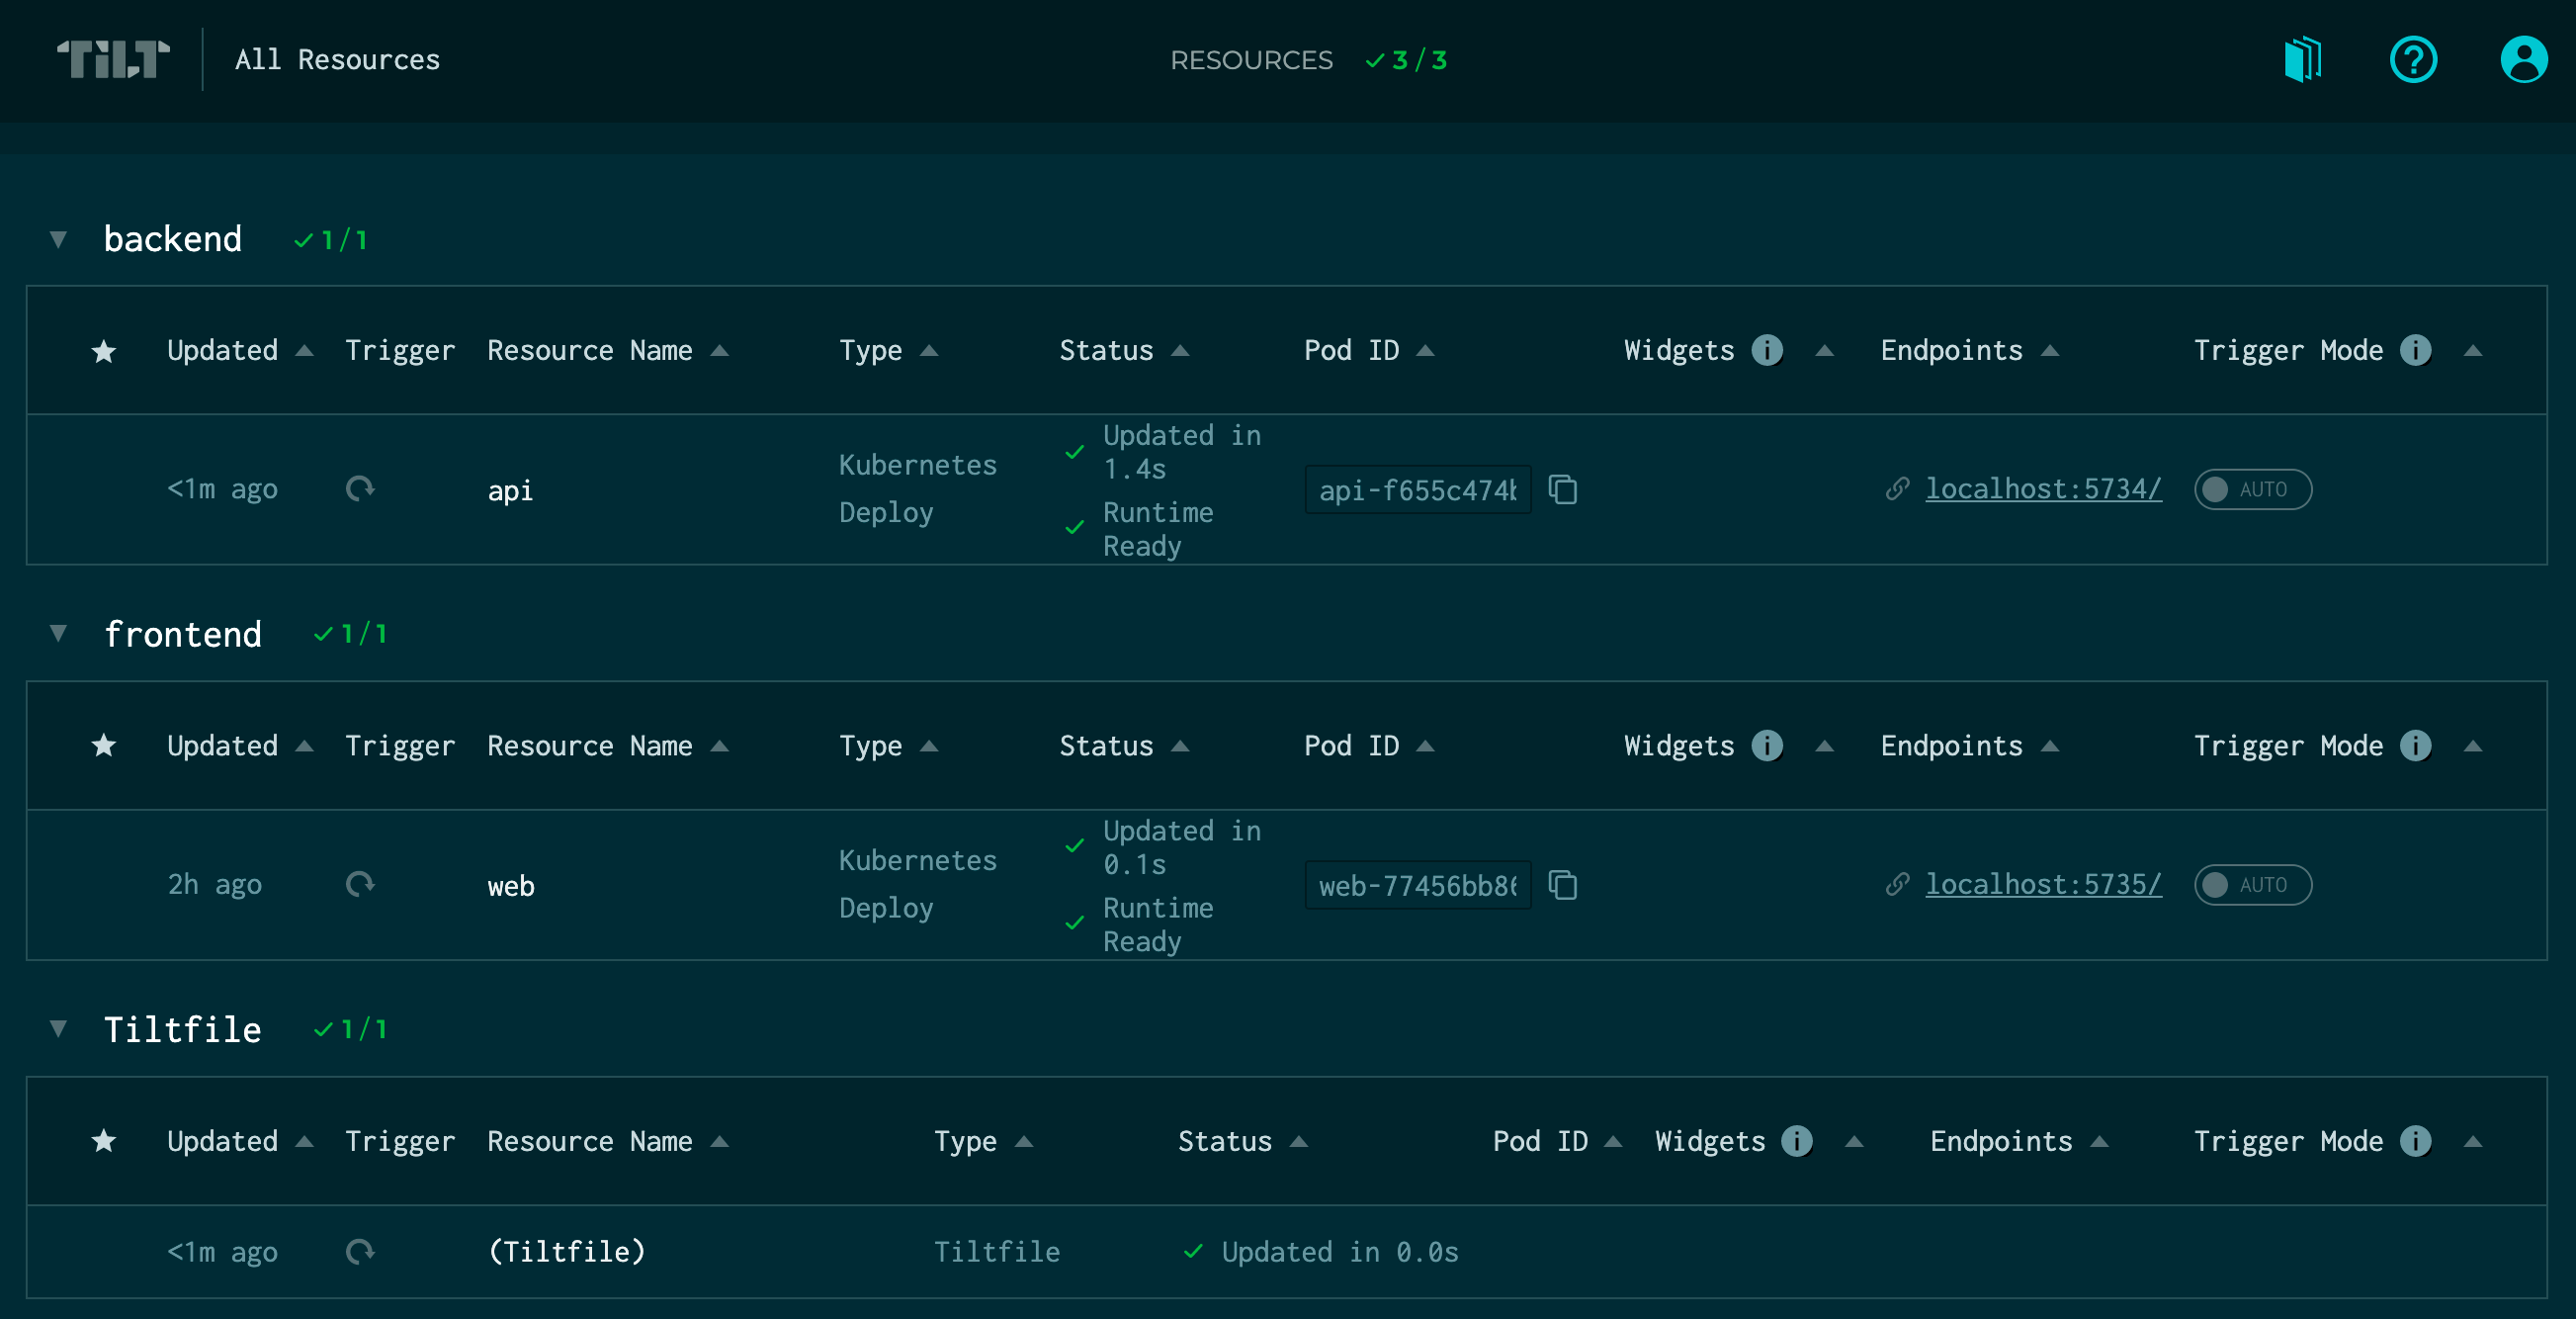
The Resource Overview is the first thing you see when you open the Tilt UI. You can always return to it by clicking the Tilt logo in the upper left corner.

This view shows all your resources (services) at a glance, grouped by their resource labels.
The Resource Overview is essential to get a quick view of your project’s entire state and offers critical info at a glance:
-
Update and Resource Status
If you look at the
apiresource row, you’ll see both the update and runtime status. Since this is a “Kubernetes Deploy” type resource, the update included building the image andkubectl applying it the cluster. The runtime status reflects the Pod’s current state in the cluster. e.g. Is it running and passing readiness checks? -
Pod ID
Copy a Pod ID to your clipboard in one click, so you can interact with it as needed via
kubectlor other tools. -
Widgets
Custom buttons let you run any one-off tasks (unit tests, lint, etc.) you’ve configured for a resource.
-
Endpoints
Remembering port numbers when you’ve got a bunch of services can be a challenge. Endpoints gives you quick access to all your Tilt managed port forwards. You can also define custom endpoints for relevant external references such as a wiki page so that they’re never more than a click away.
-
Trigger Mode
By default, resources in Tilt are updated whenever a relevant file changes. It’s possible to change the default behavior on a per-resource basis (or globally) in the Tiltfile with manual update control. The trigger mode toggles for each resource in the UI make it easy to quickly pause and resume automatic updates to it.
Even if a resource is in manual mode, it’s always possible to trigger an update on-demand!
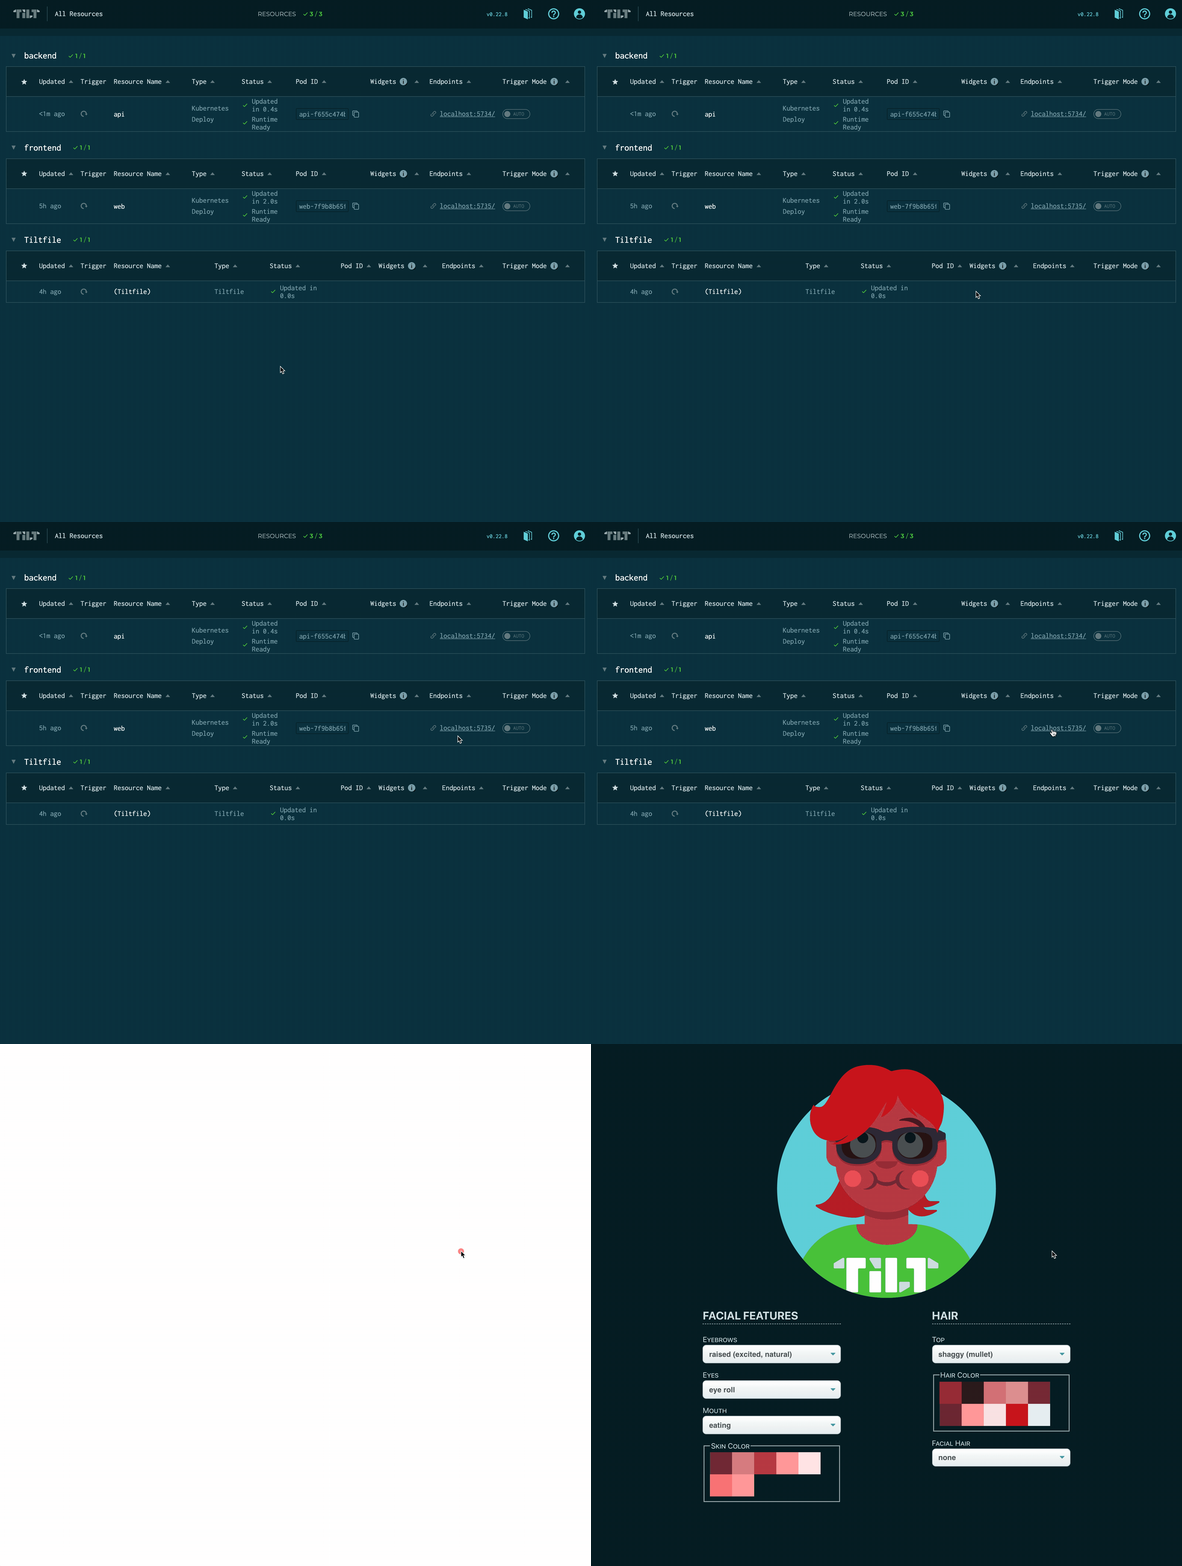
From here, click the endpoint link on the “web” resource to open the frontend for the Tilt Avatars app.

Finished making an awesome avatar? 😻
Click on the “api” resource to navigate to the Resource Details view for the respective resource.
Resource Details
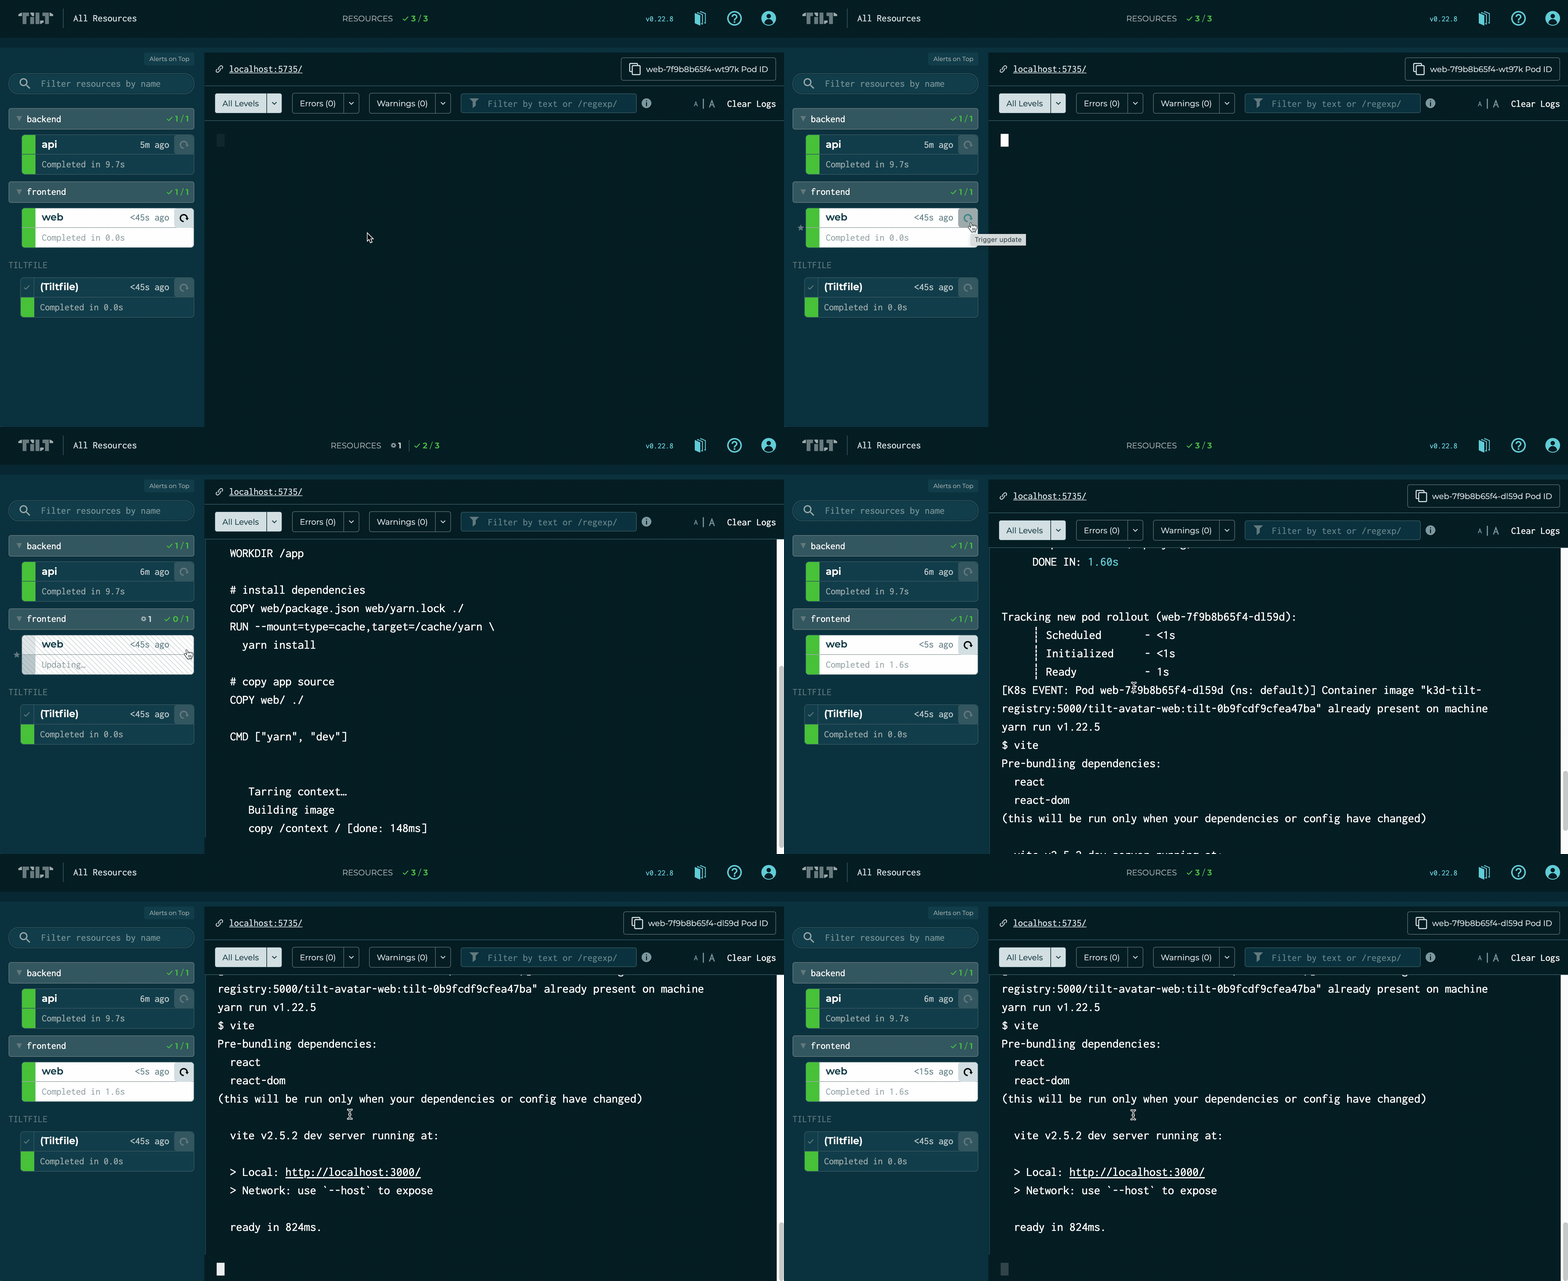
The central focus of the Resource Detail view is logs, but all the information from the Resource Overview such as custom buttons, endpoints, and pod IDs are available here as well.
Try clicking the “Trigger Update” (↻) button next to the “web” resource to run a manual update, which will re-build and re-deploy the Pod:

📚 The “All Resources” link in the navbar will show logs for all services at once instead of a single service
Log Filtering
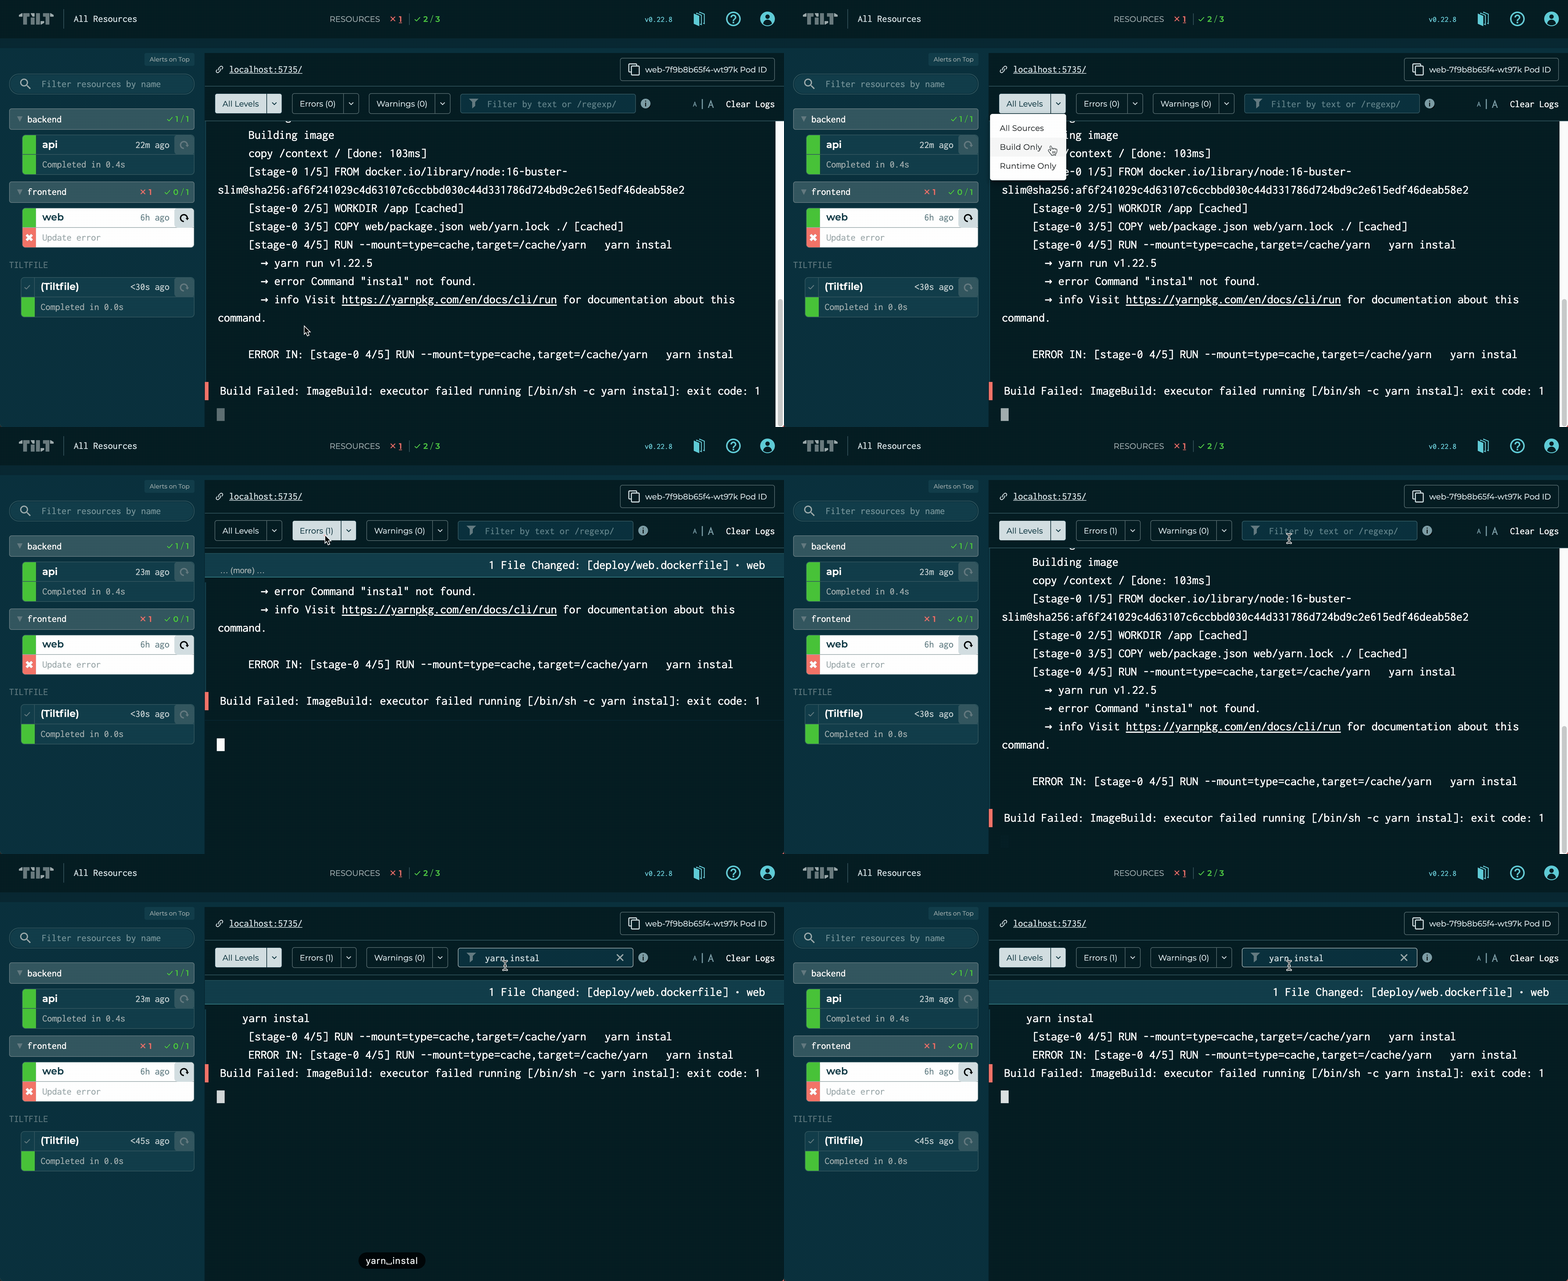
Tilt provides several mechanisms to focus your logs:
-
Source
By default, Tilt shows both build/update and runtime logs interleaved. It’s possible to restrict this to a single source. For example, if you’re trying to fix an error during your resource start, it might be helpful to temporarily hide the build logs to reduce noise as you make changes.
-
Level
In addition to unifying your logs, Tilt collects errors and warnings from different tools such as Docker build errors, Kubernetes events, and more. You can quickly filter the view to just these important events including the surrounding context by clicking
... (more). -
Keyword/Regex Filter
If you’ve ever tried to catch an error whiz by while tailing logs, you might have found yourself copying the output to a text editor to search through it. Tilt lets you non-destructively filter by keywords or regex match.

What Else?
You can extend the Tilt UI with custom buttons to run common tasks such as unit tests or lint with one-click. Buttons support parameterized inputs and the log output goes directly to the relevant resource, so you don’t have to jump back and forth between a terminal and the Tilt UI.
Otherwise, the Tilt UI is designed to be unobtrusive and run in the background, notifying you only when something needs your attention.
Multi-service development might be complex, but we aim for simplicity in the Tilt UI!